December 2012 Seattle Condo Market Report
Here’s our report on what happened with Seattle condo market in December. Prices are up 11.0%, sales are down 4.5% and the number of condos for sale is down 16.9%. The yearly summary is that prices are up 18.1%, sales up 3.0% and the number of condos for sale is down 50.8%
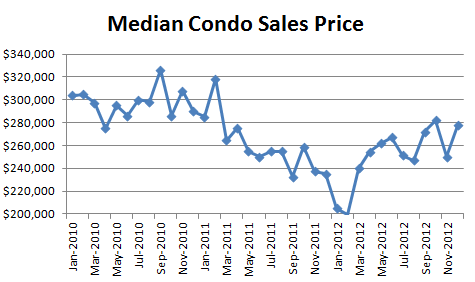
Median Sale Price Increased 11.0%
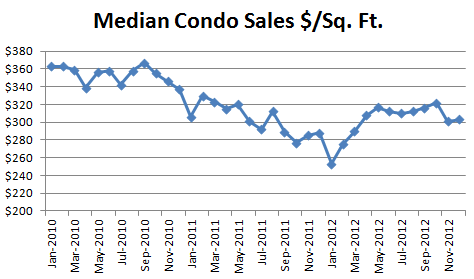
The median price for condos in Seattle was $277,500 in December, up 11.0% from $250,000 in November. Year-over-year median price is up 18.1%, as at this time last year it was $235,000. The median sale price for $/sq. ft. was $303 in November up 0.7% from $301 in November and up 5.2% from last December.
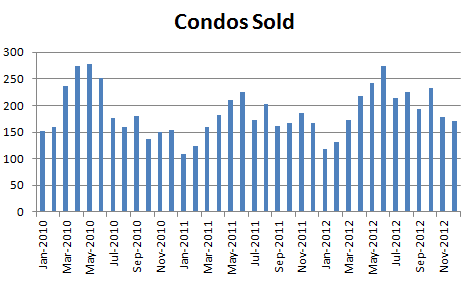
Sales Down 4.5%
There was 171 sales in December, down 4.5% from 179 sales in November. If we look at the number of business days in November versus December, sales were even at 0.1%. Last December there was 166 sales.
Fewer Condos For Sale
On the last day of December there were 349 condos for sale. On the last day of November there were 420. This is a 16.9% decline. Last December there was twice as many condos, for sale, 709. It isn’t remarkable that inventory declined in December (it is a pain to have your condo show ready over the holidays) but it is remarkable that it is at its lowest point since we started tracking it! And that there was twice as many condos to choose from a year ago.
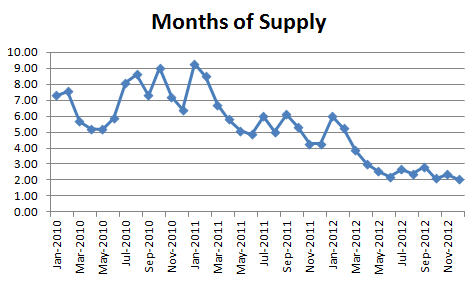
Months of Supply Keeps Ticks Back Up
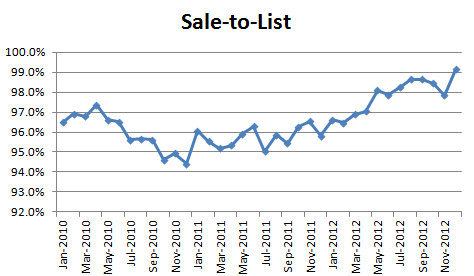
Sale-to-List at 99.1%
With so many sales and so few condos for sale buyers don’t have almost no negotiating room.
Data by Neighborhood
Wondering what your neighborhood or townhomes are doing? Check out Redfin’s spreadsheet with all the details. For many neighborhoods you’ll find 12 months worth of data.
What Does the Future Hold?
Inventory should increase in January as people fulfill that new years resolution of finally selling their place. And all the places that were taken off the market for the holidays will re-appear.
What Do You Think?
Have you been shopping for a condo recently? What do you think of what’s available for sale? Made any offers? How did those go?
Redfin has a spreadsheet available if you want to dig into the data for for a neighborhood or city not included here (or for single-family home and townhouse data.) You can also checkout the spreadsheet I have for putting the graphs together.
Disclaimer: I work at Redfin.