A Look Back at 2016 Market #’s
Looking back at what the market did in 2016 will give you a good idea of what to expect in 2017.
So what happened in Seattle in 2016 and what are the takeaways?
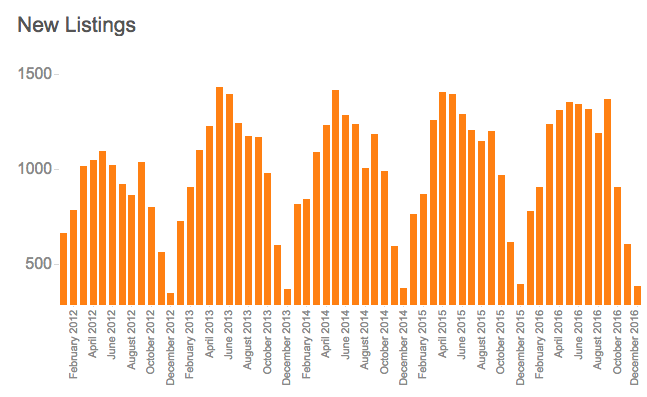
We saw the most listings in April, May, June, July with a bump up in September. Expect a similar pattern this year.
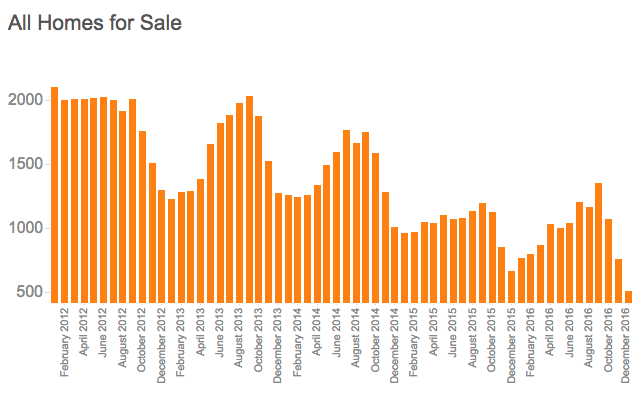
Sadly, the number of homes for sale was at an all-time low. Hopefully more homeowners realize it is a great time to sell.
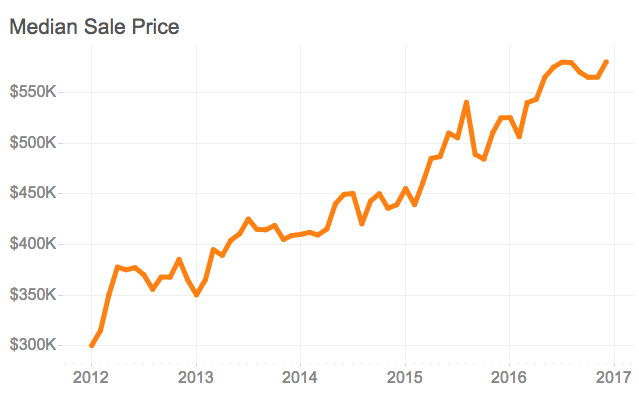
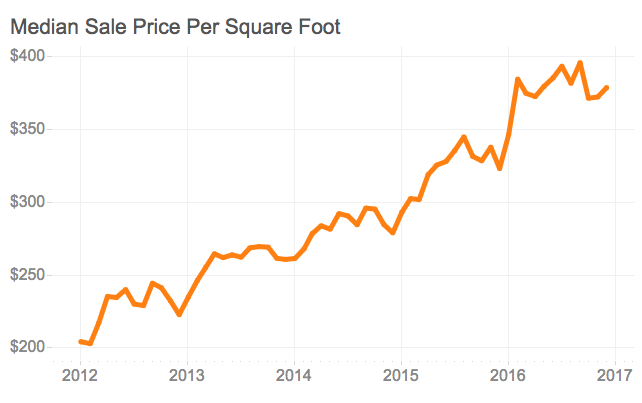
For homebuyers, prices, unfortunately went up a far amount from the beginning to the end of the year with a slight dip in the fall.
For homebuyers, prices, unfortunately went up a far amount from the beginning to the end of the year with a slight dip in the fall.
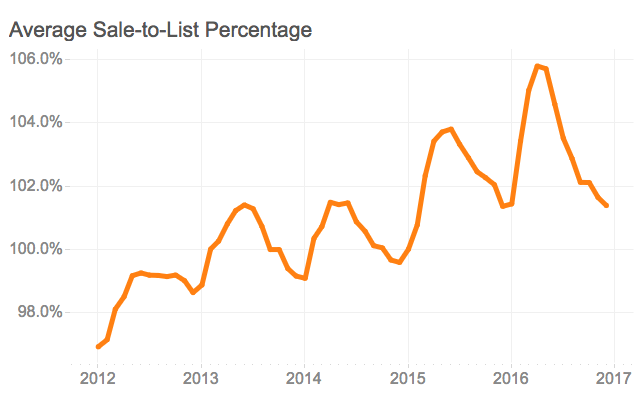
Between February and September competition was fierce driving people to pay more than list price. This year, January is off to a fast start with most homes in competitive offer situations from the get go.
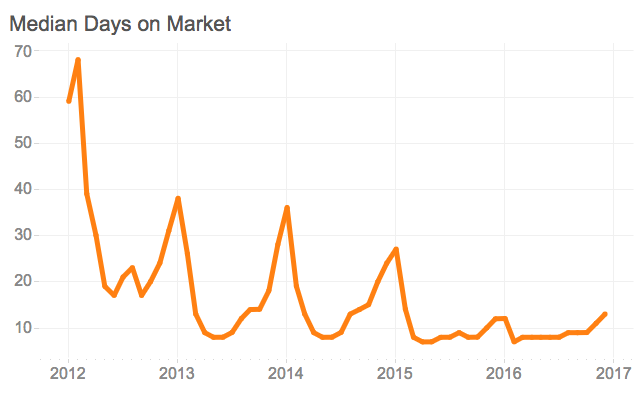
With so much competition, not surprising to see that days on market for most of the year was 7 or 8 days.
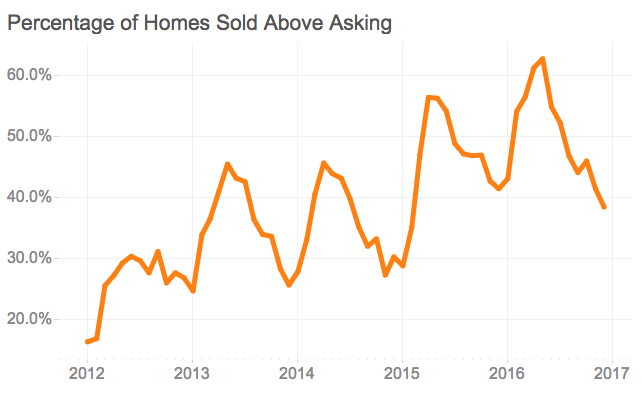
In peak months, more than 50% of homes sold for more than asking.
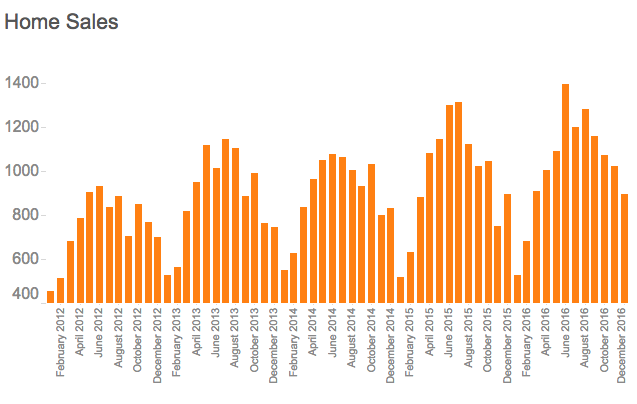
Not surprising to see that late spring, early summer is when most people closed on their homes last year.
Curious about the numbers for the neighborhoods you’re searching in? Check out Redfin’s Data Center.