Seattle Condo Market Report: Sales, Inv., Prices All Flat (March)
Today Redfin published their report on what happened with the Seattle real estate market in March, Still Searching for Spring in Seattle’s Housing Market.
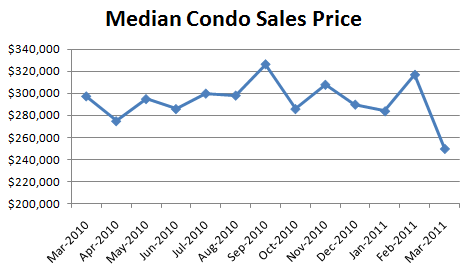
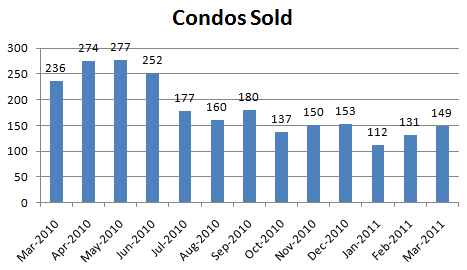
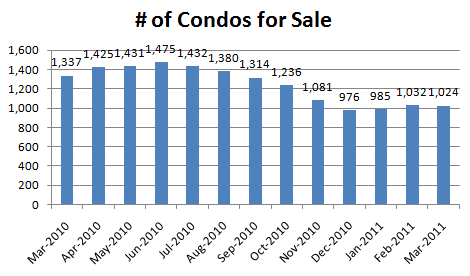
Here’s the condo numbers for the city of Seattle: the median condo price decreased 21.2% to $249,950 (don’t panic about this just yet), sales were up 13.7% to 149 sales (or were they?) and inventory decreased 0.8% to 1,024 condos on the market at the end of the month.
Median Decreased 21.2% – But Not Really
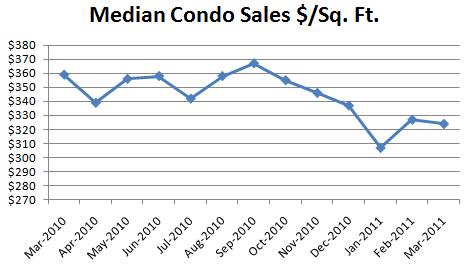
The median price for condos in Seattle was $249,950 in March, down 21.2% from $317,000 in February. Year-over-year median price is down 16.1% as at this time last year it was $298,000. A 21.2% decline sounds pretty dramatic but we’re not panicking since the median sale price for $/sq. ft. declined only 0.9% to $324/sq. ft. Looks like folks were just closing on smaller condos in March.
Sales Up 13.7% – But Really Flat
There was 149 sales in March, up 13.7% from 131 sales in February. Last March there was 222 sales. But keep in mind that the tax credit was expiring pulling demand forward. Also, before we get too excited about a 13.7% increase in sales we need to consider there are a different number of business days between February and March. When we take that into account sales were basically flat in March as compared to February.
Inventory Flat
On the last day of March there was 1,024 condos for sale. On the last day of February there was 1,032. This is a 0.8% decline. Last March there was 1,340 condos for sale. What is surprising is now that it is spring we’d expect to see more listings hitting the market. I wonder what is holding sellers back? Other than the fact that everyone who bought in the last five years is underwater.
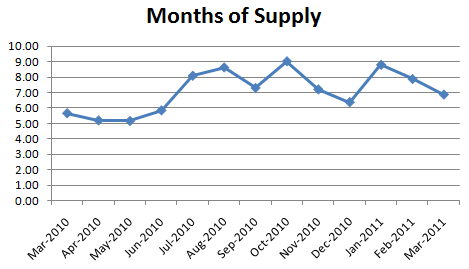
Months of Supply Declines
We’ve also seen the sale-to-list decline further to 95.1%. It was 95.5% in February and 96.8% a year ago.
Data by Neighborhood
Wondering what your neighborhood or townhomes are doing? Check out Redfin’s spreadsheet with all the details. For many neighborhoods you’ll find 12 months worth of data.
What Does the Future Hold?
I think developers are going to continue to be motivated to reduce their holdings even though they say they aren’t being pressured by the banks. Already in the last week we’ve seen Olive 8 cut prices, Pontedera Condos cut prices on a few units, Trace North is down to only a handful of units, Trace Lofts has one left and this morning Gallery sent an email blast with the headline, “Inventory Closeout – Prices start at $220,000”. As developers drop prices to move units they’ll establish market prices and regular sellers will need to follow if they want to sell.
What Do You Think?
Have you been shopping for a condo recently? What do you think of what’s available for sale? Made any offers? How did those go?
Redfin has a spreadsheet available if you want to dig into the data for for a neighborhood or city not included here (or for single-family home and townhouse data.)
Disclaimer: I work at Redfin and run the marketing team. This is one of the projects my team works on.
